ITM Physics Laboratory
Whole Atmospheric Modeling | ITM Lab | GSFC Code 675

Whole Atmospheric Modeling

The whole atmosphere is a fluid continuum from the ground to the edge of space.
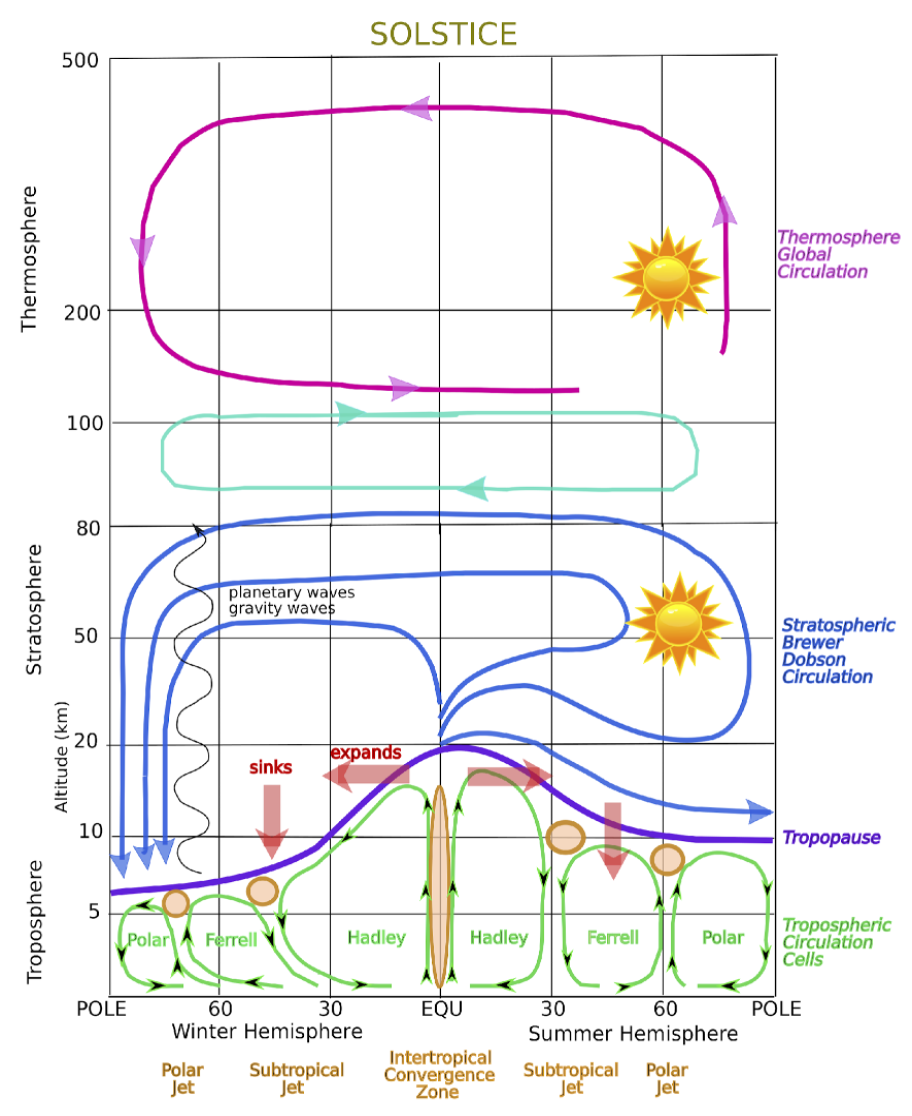
Diagram of atmospheric circulation during the solstice, showing various layers of Earth's atmosphere from the surface to 500 km altitude. It includes global circulation patterns such as the Hadley, Ferrell, and Polar cells in the troposphere, as well as planetary waves and gravity waves in the stratosphere. The thermospheric global circulation is shown at the top. The diagram also highlights features such as the polar, subtropical, and tropospheric jets, and the Intertropical Convergence Zone (ITCZ). The image depicts both winter and summer hemispheres, showing how air masses expand and sink in different zones.
Whole atmosphere circulation during solstice. Credit: Dr. J. Lean, NRL (retired)

The whole atmosphere modeling group in 675 is working with the Goddard Earth Observing System (GEOS), and its data assimilation technology (JEDI) to provide support for NASA missions and retrospective analysis in the whole atmosphere. The ITM whole atmosphere modeling group goal is to advance the understanding of the coupling of terrestrial with space weather.
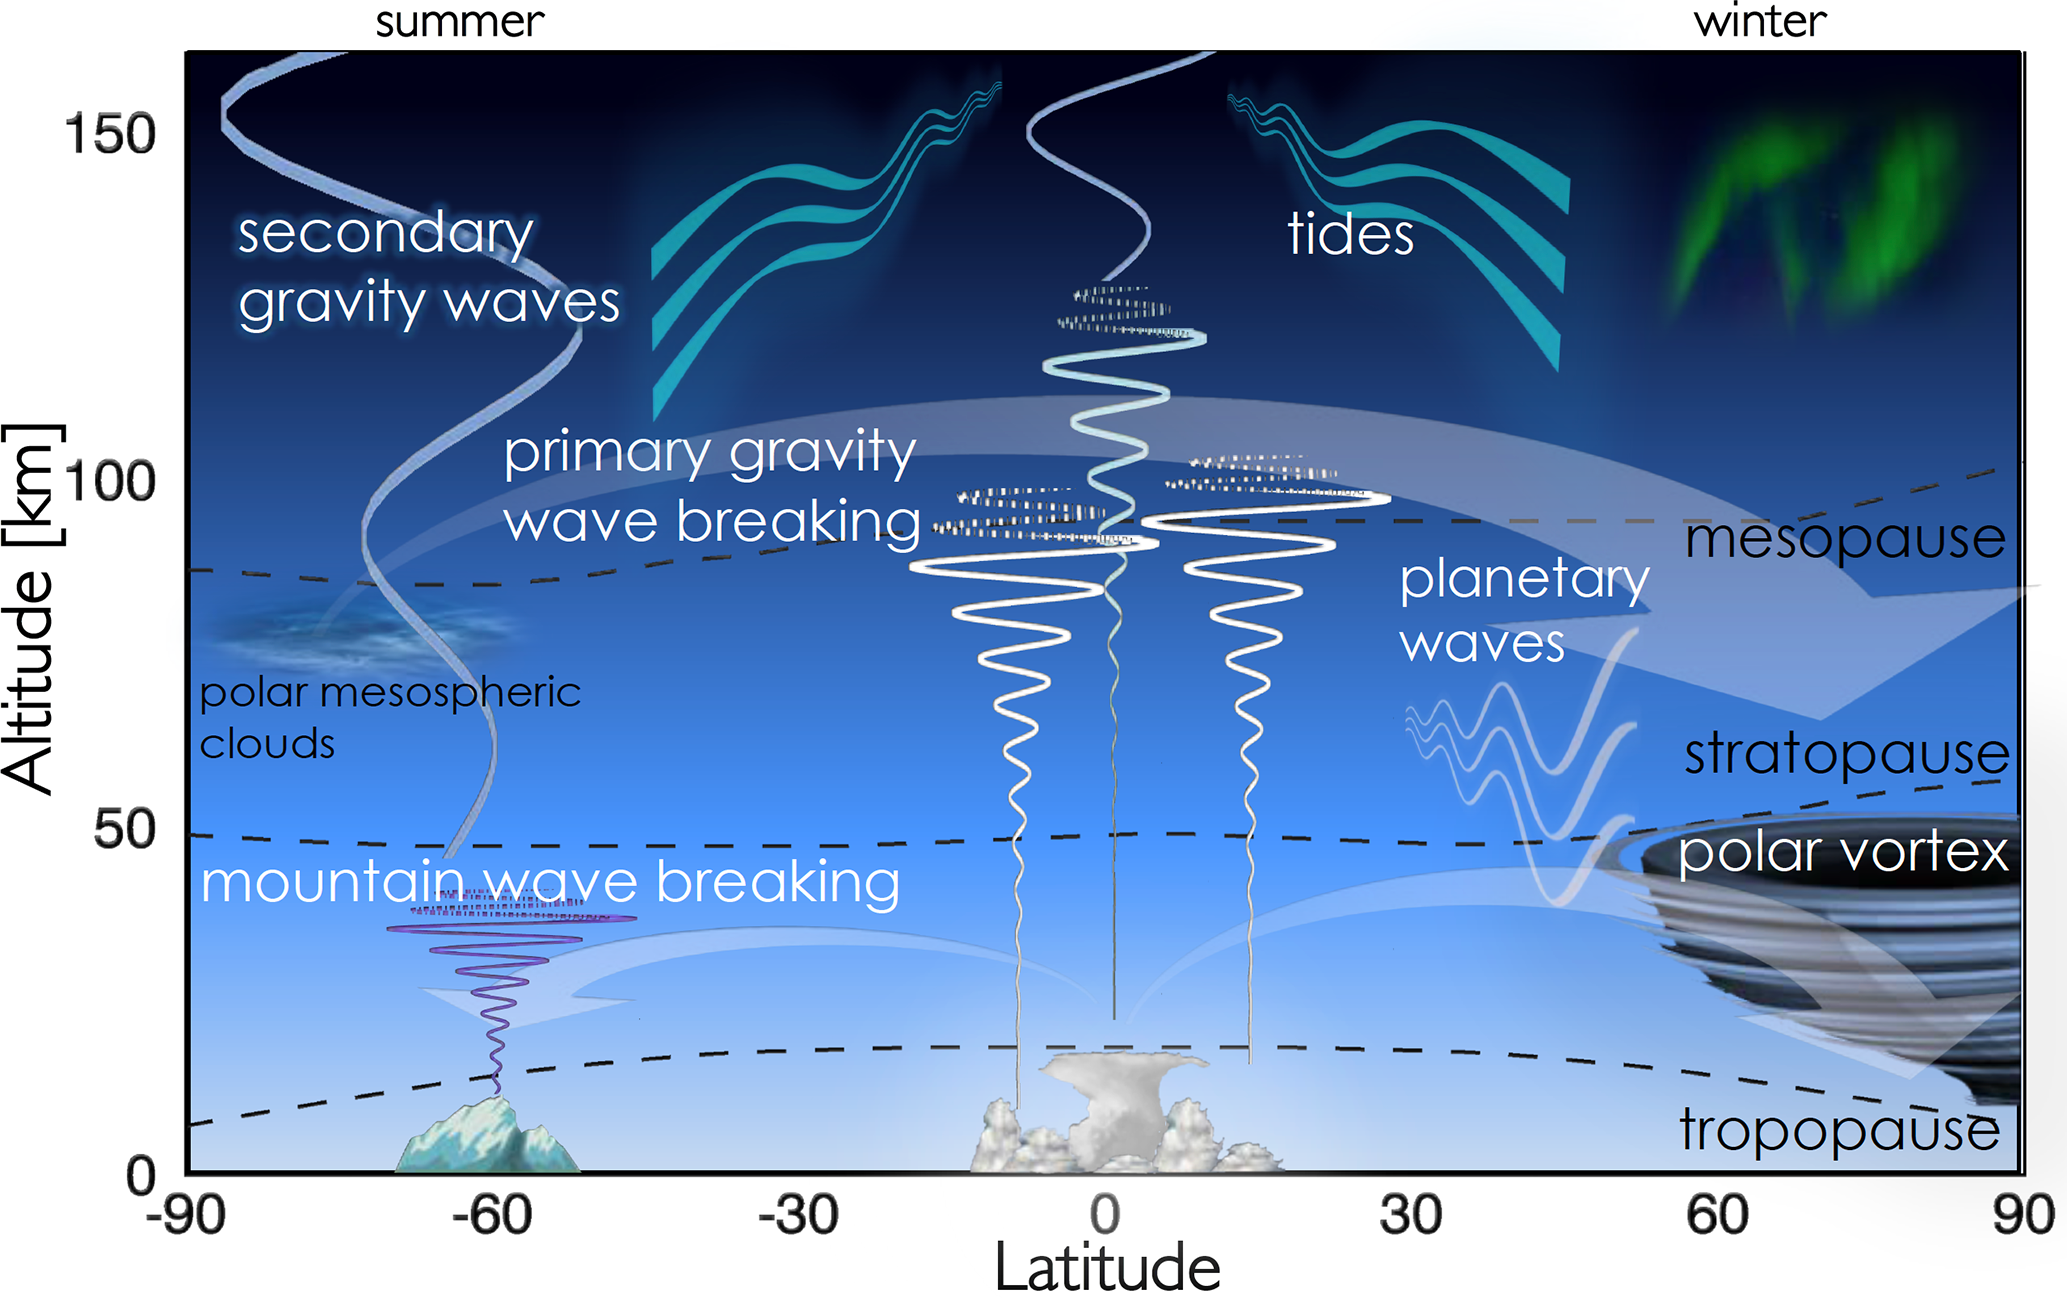
Diagram illustrating atmospheric dynamics across latitude and altitude, showing meteorological variability in different regions. It features phenomena such as secondary and primary gravity wave breaking, tides, planetary waves, mountain wave breaking, and the polar vortex. The altitude ranges from the troposphere (surface level) to over 150 km, with labels marking the tropopause, stratopause, and mesopause. The diagram differentiates between summer and winter conditions, with polar mesospheric clouds in the lower latitudes and the aurora visible near the polar regions.
Source of meteorological variability in the upper atmosphere. Credit: https://doi.org/10.5194/acp-21-17577-2021

The group is tasked with incrementally and sequentially expanding the vertical domain of GEOS to:

  • Augment use of heliophysics observations in comprehensive Earth system models and upper atmospheric re-analysis.
  • Advance predictions of thermospheric/ionospheric processes that support NASA missions and geospace physics challenges.
  • Support space weather research and coupling that include electrodynamics and space weather processes.

Key science drivers of the Whole Atmosphere group are:

  • Physical and Chemical Interactions
    • Different processes occur at different altitudes that affect missions, economy and society.
  • Weather and Climate Change
    • The upper atmosphere and the lower atmosphere are coupled. Patterns of teleconnections from the ground to the thermosphere exist but are poorly understood.
  • Climate Research to Solar Variability
    • A system of systems: understanding holistically the Sun, space weather, and Earth sciences.
  • Spacecraft Orbiting and De-orbiting
    • NASA operational interest in management of spacecrafts orbiting Earth and their safe re-entry in the atmosphere.

Data Assimilation

In the last two decades the ITM observations of dynamics and ion-neutral composition demonstrated a great potential of satellite missions (TIMED, EOS Aura, AIM, GOCE, CHAMP, VIIRS, GOLD, ICON, COSMIC-2, GRACE, and GRACE-FO) to explore the coupling between vertical layers, hemispheres and regions driven by multi-scale dynamics. These satellite data have been used to evaluate the Space Weather (SW) model predictions in the ITM and its variability. The whole atmosphere modeling and data assimilation group in partnership with the GMAO/GSFC will support the current, novel and planned NASA ITM missions by examining the impacts of new instruments and observing strategies on the analysis and prediction of space weather.
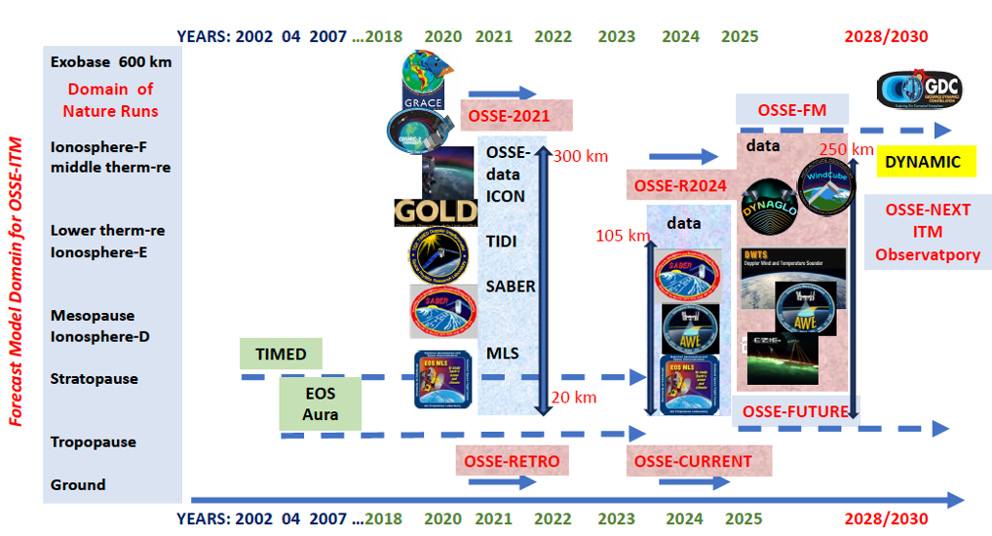
Diagram showing the forecast model domain for OSSE/ITM (Observing System Simulation Experiments/Ionosphere-Thermosphere-Mesosphere) from 2002 to 2030. The left side indicates the vertical layers of the atmosphere, from the ground to the exobase (600 km altitude). Horizontal timelines represent different phases of OSSE: OSSE-RETRO (2002-2020), OSSE-CURRENT (2020-2025), OSSE-FUTURE (2023-2025), and projected phases like OSSE-NEXT (2028/2030). Key missions and instruments, such as TIMED, EOS Aura, GOLD, ICON, SABER, MLS, and future missions like GDC, are shown at various altitudes ranging from 20 km to 300 km. The diagram highlights the progression of data collection for OSSE from past, current, and future missions, with different instruments providing data for various layers of the atmosphere. A section marked 'DYNAMIC' shows the transition toward future observations, scheduled between 2028 and 2030.

We will also estimate the impacts of proposed new ITM observatory, represented by GDC and DYNAMIC missions, on the space weather predictions using the OSSE-ITM in the whole atmosphere modeling framework. OSSEs for the GDC+DYNAMIC ITM observatory will assist to assess different designs of the new satellite systems before their instruments are actually built or deployed. The OSSE-ITM system will be based on the GEOS-OSSE infrastructure of GMAO employing the novel JEDI framework recently implemented and tested in GEOS-DAS for the Earth Observing System.

Past Projects
FY24 STG TBD
FY24 IRAD The goal of this IRAD proposal is to bridge a critical component of space weather modeling that is currently missing at GSFC. NASA heliophysics data have been used only sporadically with other Earth observations to build a whole Earth system view that can lead to (1) a climate record from the surface to the upper atmosphere, and (2) products that can be utilized in support of planned spaceflight missions. The purpose of this project is to add SABER mission data available for the past 20 years to the data assimilation cycle of the Goddard Earth Observing System (GEOS). This will extend the validity of GEOS to the mesopause and is the first step toward including other heliophysics observations in a vertically extended domain of GEOS.
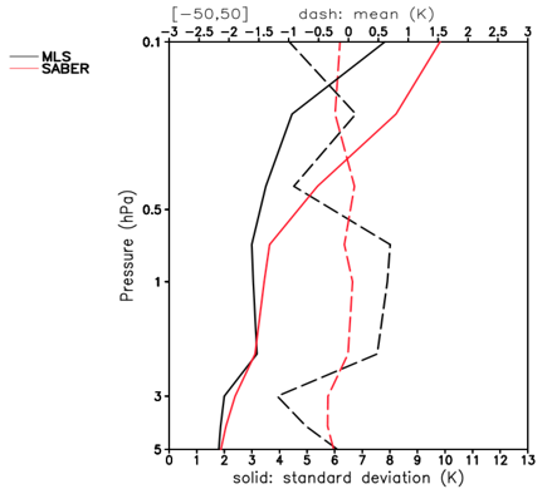
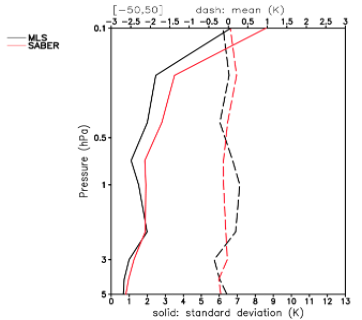
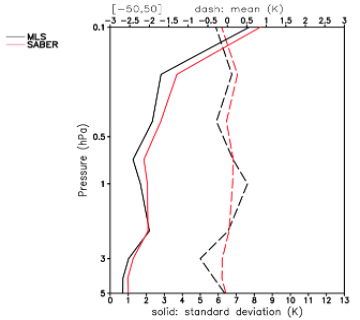
Graph comparing temperature profiles from MLS (black line) and SABER (red line) measurements, with pressure (in hPa) on the vertical axis and temperature (in Kelvin) on the horizontal axis. The solid lines represent the standard deviation, while the dashed lines represent the mean temperature differences between the two instruments. The pressure ranges from 5 hPa to 0.1 hPa, and the temperature deviations span from approximately -3 K to +3 K. The plot shows how temperature measurements vary across different pressure levels in the atmosphere. Graph comparing temperature profiles from MLS (black line) and SABER (red line) measurements, similar to the previous image, with pressure (in hPa) on the vertical axis and temperature (in Kelvin) on the horizontal axis. The solid lines show the standard deviation, while the dashed lines indicate the mean temperature differences between the two instruments. The pressure ranges from 5 hPa to 0.1 hPa, and temperature deviations span from approximately -3 K to +3 K. The chart highlights the variability in temperature readings across different atmospheric pressure levels. Graph comparing temperature profiles from MLS (black line) and SABER (red line) measurements, with pressure (in hPa) on the vertical axis and temperature deviations (in Kelvin) on the horizontal axis. The solid lines represent standard deviations, while the dashed lines represent the mean temperature differences between the two instruments. The pressure ranges from 5 hPa to 0.1 hPa, and temperature deviations range from -3 K to +3 K. This graph depicts the atmospheric temperature variability at different pressure levels, showing close agreement between MLS and SABER measurements.
These panels illustrate to effectiveness of assimilating either MLS-T or SABER-T. Panels show means (dash) and standard deviations (solid) of Observation-minus-Background fits when: (L) Neither data are assimilated (both passive); (C) only MLS is assimilated; (R) only SABER assimilated. Notice that assimilating either MLS or SABER improves the fit of the corresponding passive data.
Current Projects
FY25 HISFM TBD
FY25 IRAD This project aims to produce a historical dataset of atmospheric neutral winds in the mesosphere and lower thermosphere (MLT; ~80-100 km altitude) in formats ready for integration into the vertically extended GEOS model. We will also collaborate on collating a homogenized and quality-controlled record of Earth observations.
Dynamic Mission TBD: DYNAMIC-X & DAPHNE